
1st Issue of
November 2006
New Homes: The Five-Year Picture
The current over supply situation became undeniable when our
market exceeded the historical record for specs eight months ago (2,400 specs
reported the week of January 15th).
This article provides you with a historical perspective and a glimpse of
the bigger picture of the new homes market than the Current New Homes Market
article.
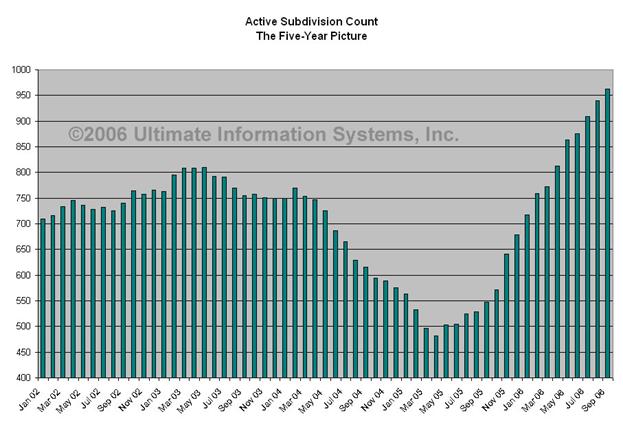
Five-Year Subdivision Count
The following five-year graph shows a normal ebb and flow of
active subs; the count climbs in late spring, when builders are presumably
preparing for the summer when sales are typically higher, and declines a little
in late summer. In 2004 and 2005 the
active sub count dropped dramatically with the investor/speculator boom, when
plans for coming subdivisions could not be acted upon as fast as active
subdivisions were selling out. The
lowest count was 482 active subs in May 2005.
Compare that with the current count of 980 active subs and you can see
that the active sub count has more than doubled in the past year and a half!
We define an active subdivision as one accepting contracts
from qualified buyers. The subdivision
count data we report comes from the Ultimate
New Homes (UNH) database, which covers the entire
For more on
the UNH Database, please see the Current New Homes Market article in this
issue.
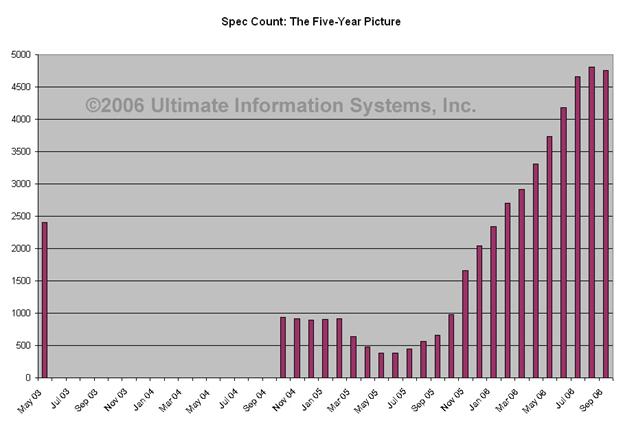
Five-Year Spec Count
The UIS spec count is made up of the individual properties
that each subdivision chooses to report to us to be included in our system for
ARMLS affiliates. The degree of completion will vary from builder to
builder and from one subdivision to another.
We believe our current count is on the conservative side, as some subdivisions
do not report their total specs to us.
We only have comprehensive spec data going back through
October 2004. Prior to that our data is spottier,
but we know that the highest historical spec count was 2,400 in May 2003. Even with this partial data a pattern is readily
apparent. Spec counts maintained a modest
level through 2004, and bottomed out in 2005 during the real estate boom when
supply struggled to keep up with demand.
Since October of last year, however, the spec count climbed steadily. Only in the past month has it fallen off, but
it is still almost ten times what it was at the lowest point in June 2005 and
twice the number of anytime prior to 2006.
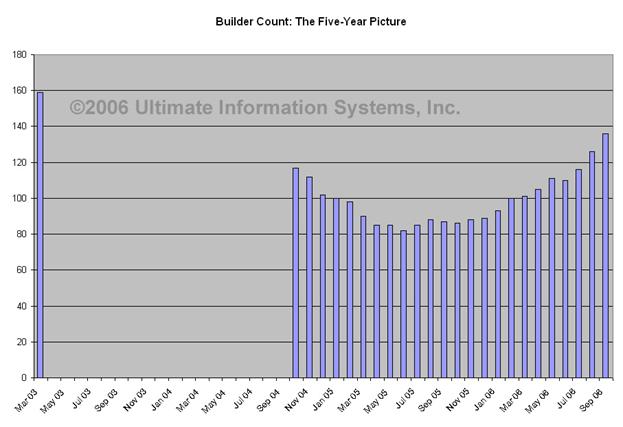
Five-Year Builder Count
Again, here we are lacking complete five-year data, but a pattern
is still visible. We have the highest
historical builder count in March 2003 (159 builders), and a slow decline of
builders since then. The builder count
started rising again in June 2005, and is now back up to 139.
Commentary
The subdivision and spec counts and graphs clearly
illustrate that the
It is our belief that we will not see what would be
considered a normal market until the spec count has been reduced to about 2,500
and the subdivision count is back in the range of 800. However, even when these levels are reached
the resale inventory must be considered. Therefore, we conclude that we are
still many months away from a balanced market.
Copyright® 2006 - This information is compiled and
written by Ultimate
Information Systems, Inc. Use of this article, in part or in its entirety,
is expressly prohibited without written permission. Click
here to request limited rights to reuse this information.