IN-DEPTH ANALYSIS
December 2010
Resale
Sales Analysis
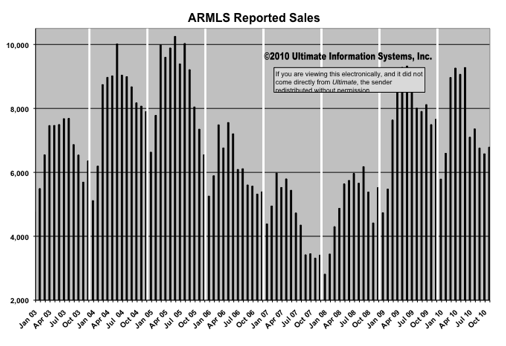
The November ARMLS1 Reports reported sales of 6,789,
which is a increase of 208 from October.
On a seasonally adjusted basis sales were down 704 from November 2009. Sales have been below the level of one year ago for the past six months.
Sales
Patterns
There
are several different factors that interact to make up the current sales
numbers. One of the most
significant is the seasonal pattern clearly seen in the graph below. The winter months show the lowest sales
volume, while the summer months are the highest in sales.
 \
\
This basic pattern is true for each year displayed. Be
cautious of any article that only compares one month to the prior month and
does not reference the year prior number.
Additional factors are abnormal market conditions. Examples of these are:
· The investor/speculator craze in
2004 and 2005
· The credit crunch starting mid 2007
Therefore, a comparison of 2006 sales level with that of
2004/2005 just reflects a return to a more healthy market activity level. The further decline in the first half
of 2007 is the beginning of a correction for the oversupply situation, which
was created in 2004/2005. Then the credit crunch hit. Note that the last half of 2008 recovered to a level that is
fairly comparable to the first half of 2007.
Over the last four years we have stated that sales similar
to the 2002 and 2003 sales volume represented a normal sales level for the
Phoenix metro area market with the then current interest rates and job
growth. However, interest rates,
job growth, population growth and consumer confidence are definitely not what
they were when we made that statement.
We now believe that the 2001 – 2002 level offers a better
reference basis for a normal Phoenix market.
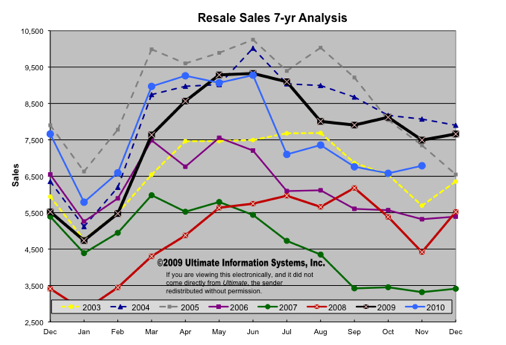
Historical Patterns
In
addition to the seasonal pattern, note the monthly sales volume increase of
each year from the previous year.
This pattern existed throughout 2002-2005, until October 2005. From October 2005 to May of this year,
sales were well below that of the same month a year prior. For the past eighteen months we have
seen sales rise above what they were the same month a year prior. This relationship is shown in the graph
below.
Copyright® 2010 - This information is compiled and
written by Ultimate
Information Systems, Inc. Use of this article, in part or in its entirety,
is expressly prohibited without written permission. Click
here to request limited rights to reuse this information.
1 (ARMLS)
Arizona Regional Multiple Listing Service encompasses most of Maricopa and
Pinal Counties.
Note: This report was prepared utilizing
numbers from an adjusted August 2008 report published by ARMLS after the
distribution of the August In-Depth Analysis Newsletter. In all cases the
impact of these adjusted numbers is less than 1%.