IN-DEPTH ANALYSIS
February 2010
January ARMLS Reports
Resale Listings
The listing count reported in the
January Arizona Regional Multiple Listing Service (ARMLS1) Reports,
which were released on February 16th, was 41,506—up 1,797 listings from
the December reports. In March 2009 the listing quantity dropped below
50,000 for the first time in 27 months.
After three months of rapid decline and falling to a level below 40,000,
the listing count has been creeping back up over the last seven months to this
month’s level. The current level remains
substantially above the record level of listings prior to January 2005 which
was 30,046 listings in February 2003.
Resale Sales
ARMLS-reported sales for January dropped
24.4% from the December sales figure with a decrease of 1,872. On an annually adjusted basis sales were up 1,053 or about 22% from January 2009. This is the ninteenth consecutive month that
there has been an increase in sales over the same month in the prior year.
January’s sales quantity is typically
lower than December’s, so this month’s change is following the normal calendar
cycle. In the normal calendar cycle,
sales tend to be highest in the summer and then gradually taper off over the
next few months before resuming the climb during the first quarter of each
year. The winter months are consistently
the lowest in sales.
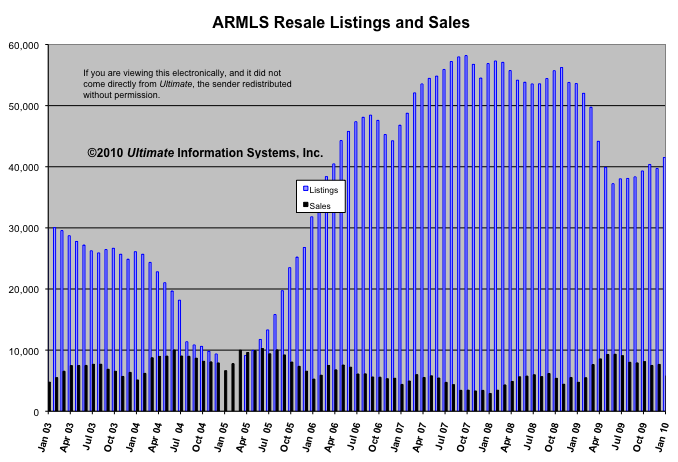
Our sources of data for these displays are the ARMLS
reports. In these, there are three
months, January – March 2005, for which we have not shown listing data because
of apparent discrepancies. Additionally,
ARMLS notes that the listing information for March through August 2002 may
contain errors, but we have chosen to display this reasonable data above.
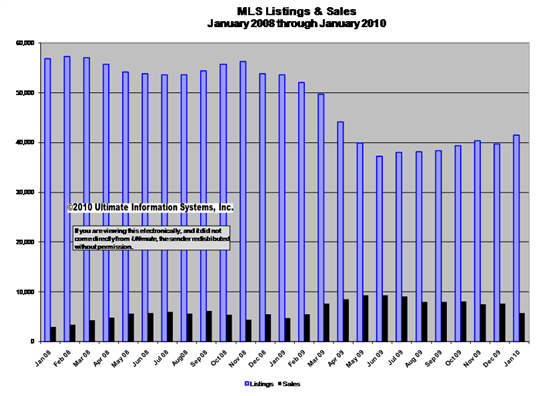
A Two Year Perspective
The graph below displays the same data
as above, but focuses on only the most recent 24 months.
Adjusted Monthly Sales
Trend
Sales, when compared to one year ago,
rose for the eighteenth month in a row.
This increase of 2,137 is illustrated in the chart below.
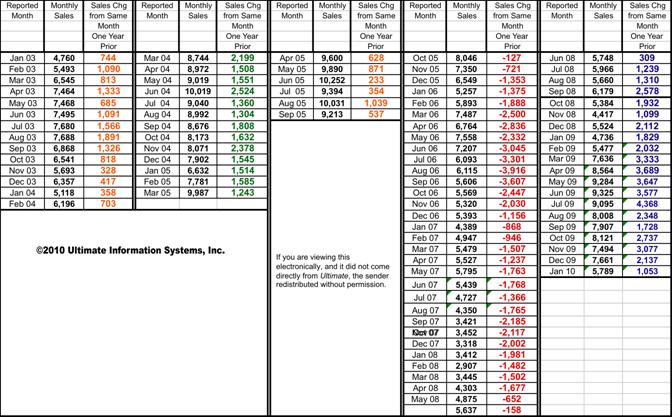
The above chart is divided into market
condition segments by comparing current sales activity to the sales activity
during the same month in the previous year.
Orange reflects relatively normal conditions; Green shows higher than
average sales; and Red indicates slowing market activity. Blue designates the months with sales volume
increases while prices were falling or stable.
Analysis of these figures clearly shows
the following:
1.
From January 2003 through September
2005, sales increased every month when compared to that month in the year prior
(from orange to green, then back to orange).
2.
Every sales number from October 2005
through May 2008- thirty-two months - reflects a decrease in sales from the
same month in the year prior (red).
3.
Starting in June 2008 each month has
shown an increase in MLS sales from the same month one year prior (blue).
Copyright® 2010 - This information is
compiled and written by Ultimate Information Systems,
Inc. Use of this article, in part or in its entirety, is expressly
prohibited without written permission. Click here to request limited rights to reuse this information.
We welcome your comments, just click here.
1
(ARMLS) Arizona Regional Multiple
Listing Service empasses most of Maricopa and Pinal Counties.