IN-DEPTH ANALYSIS
February 2010
Resale Sales Pricing Analysis
The Median Price in the recently
released January ARMLS1 resale sales reports is $123,000, down $3,500
from the December reports. The Average
Price decreased from $177,500 to $175,700.
The graph below displays both the monthly Average Price and Median Price
of resale homes sold in MLS from January 2002 through January 2010.
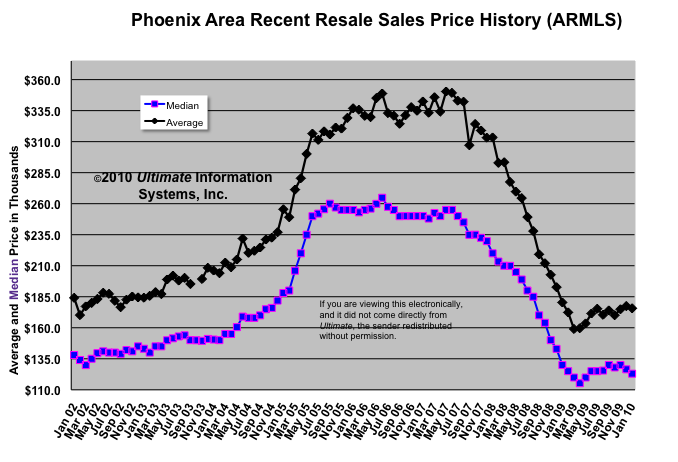
The
average price is calculated by dividing the sum of the sales prices by the
number of homes sold. The median price
is determined by finding the price where the quantity of homes sold for less
than that price is equal to the quantity of homes sold for more than that
price. The median is a better indicator
of the overall market.
Patterns Emerge When the Time
Period is Subdivided
When
there is a change in the slope of the line for several consecutive months, it
indicates a new pattern is emerging.
Five such changes appear on this graph.
The display below has been subdivided at each change in slope:
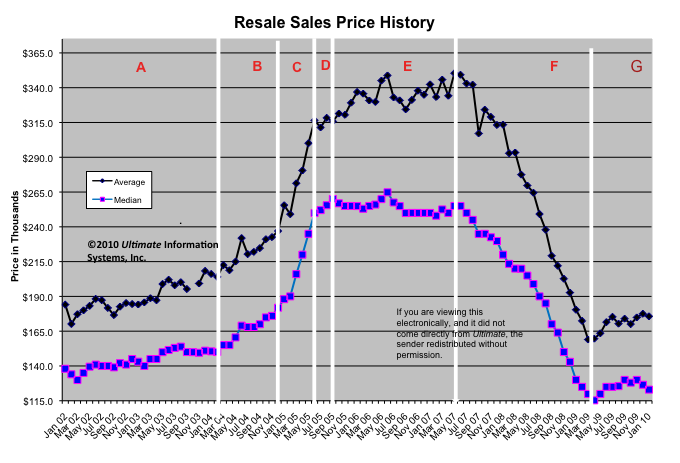
Segmented History
At each change in slope of
the lines in the graph above, a shift in trend has taken place. We have
identified seven such distinct market conditions (detailed below). Slow steady
growth was experienced from 2002 through 2003 and into very early 2004.
Then between March 2004 and February 2005, the median home sales price
increased by $40,000. In the four months after that a $60,000 increase
happened during the hot market of early summer 2005. Starting in July
2005 and lasting through September the market experienced a clear shift back to
a more normal appreciation rate. October 2005 was the first month in a
period of flat prices and this continued for 21 months through June 2007. July
2007 was the first month in the sixth market condition of rapidly falling
median home prices. In July 2009 we reached another turning point of flat
prices at the bottom of the market.
The seven market conditions
are defined in the following table:
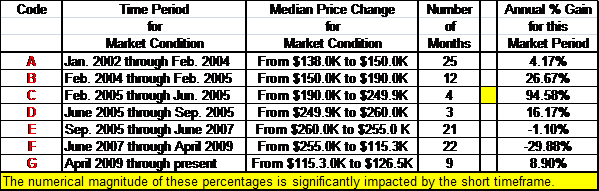
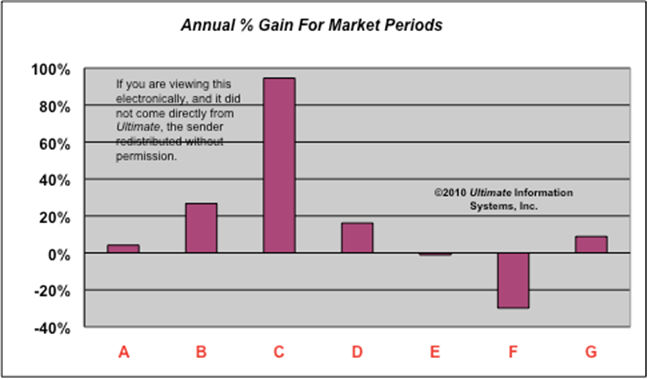
The annual rate of appreciation (listed
as “Annual % Gain for this Market Period” in the chart above) is graphically
represented below:
Copyright®
2010 - This information is compiled and written by Ultimate Information Systems, Inc. Use of this article, in part
or in its entirety, is expressly prohibited without written permission. Click here to
request limited rights to reuse this information
1 The Arizona Regional Multiple Listing Service encompasses
most of Maricopa and Pinal Counties.